Bocal graphs
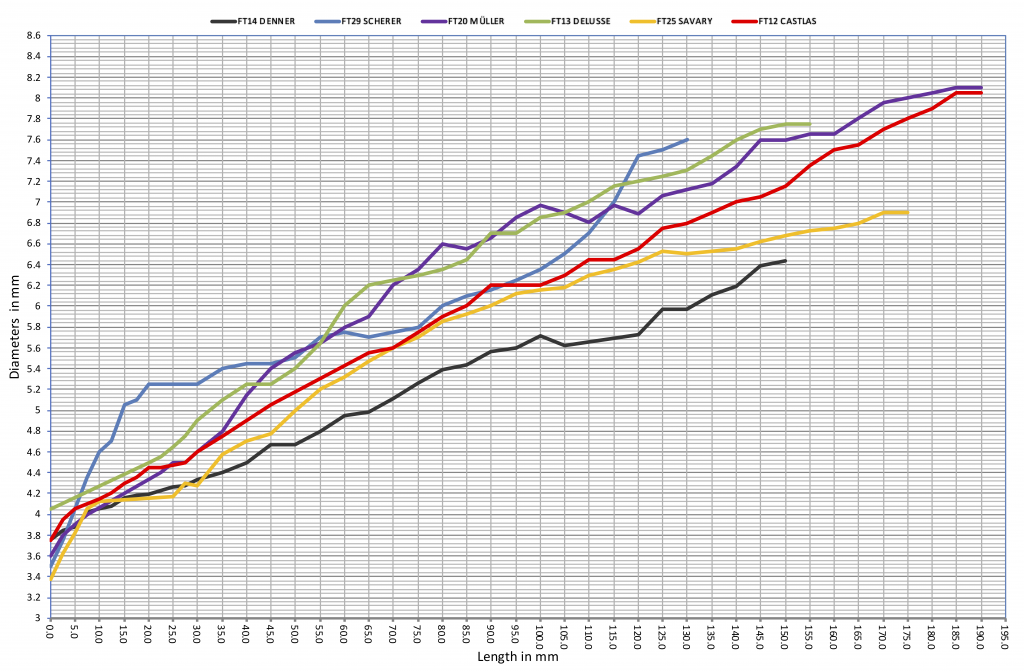
Graph 1 depicts a comparison of calculated internal diameters of six surviving fagottino bocals, starting at the smaller reed end.
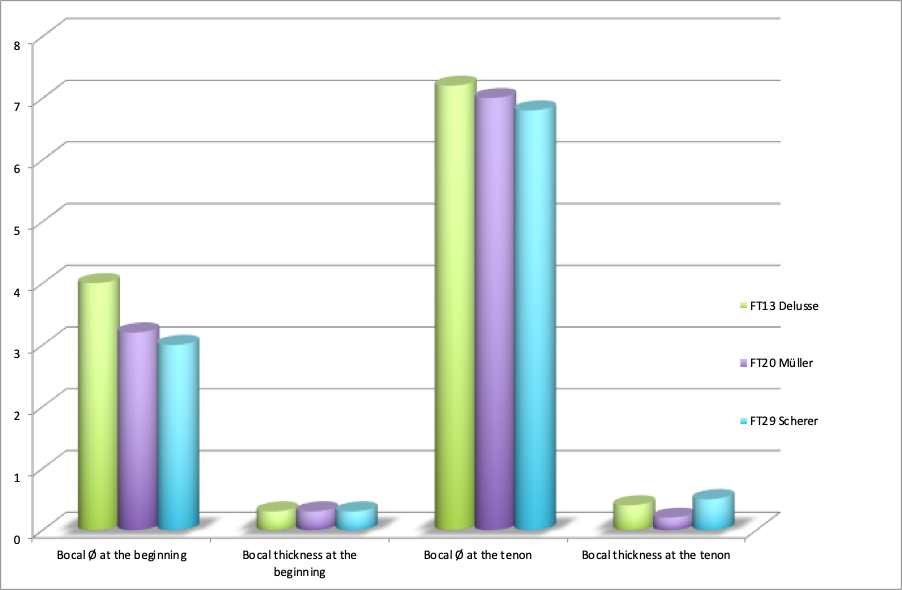
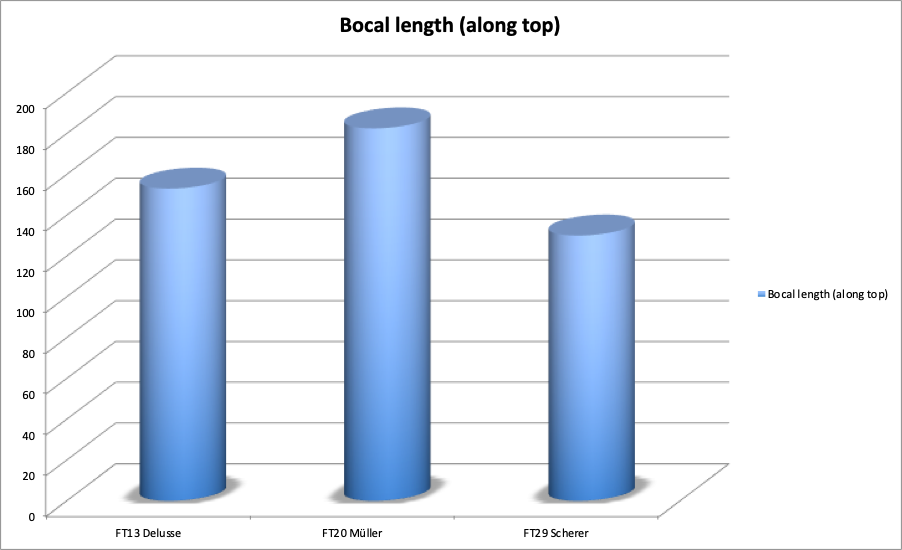
Graph 2 shows differences in diameters and lengths between the two models, FT29 Scherer and FT13 Delusse.

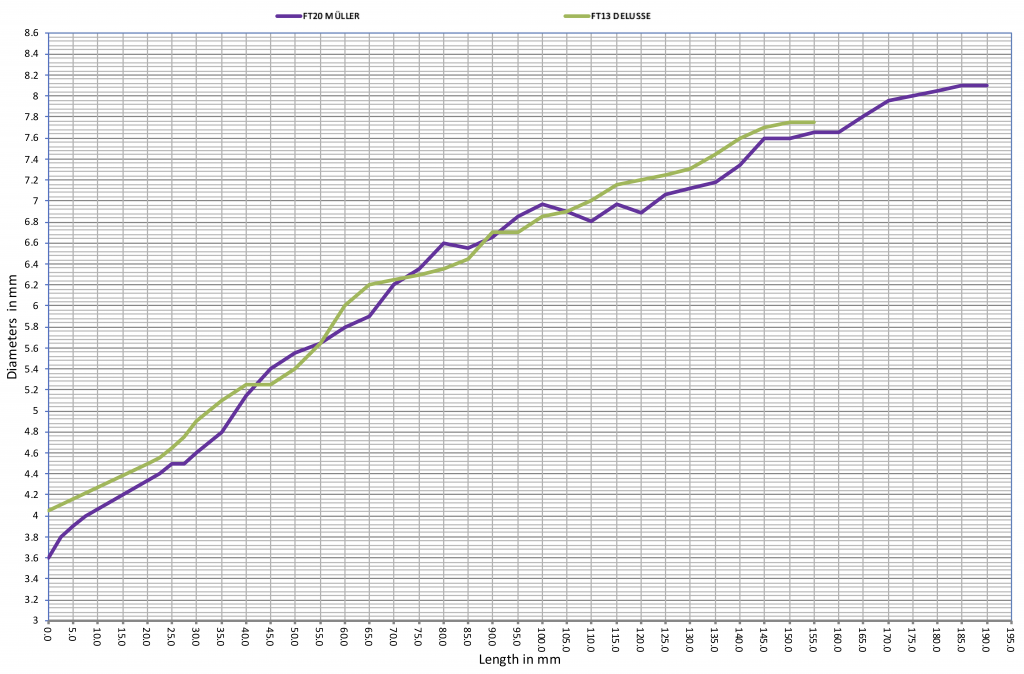
Moreover, Graph 3 illustrates that the diameter trend of FT13 Delusse is very similar to that of FT20 Müller, although shorter in length.
A very large amount of raw bocal measurement data was compiled and compared to be used in this study. Please contact us if you wish to receive this specific information.