
SCCER Digitalization
Application of clustering methods for the analysis of smart metering and grid elements’ data.
In the context of “Energy Strategy 2050,” Swiss grid operators are obliged to replace old electricity meters with intelligent electricity meters, or “smart meters,” by 2027. The SCCER smart grid pilot with Arbon Energie AG provides data from ca. 10,000 smart meters from various kinds of consumers, which can be clustered to evaluate and better understand the existing customer segmentation. Besides, data of grid elements can be studied in order to better understand the situation in the grid and the condition of individual elements. The results can be used for asset management and grid operation.
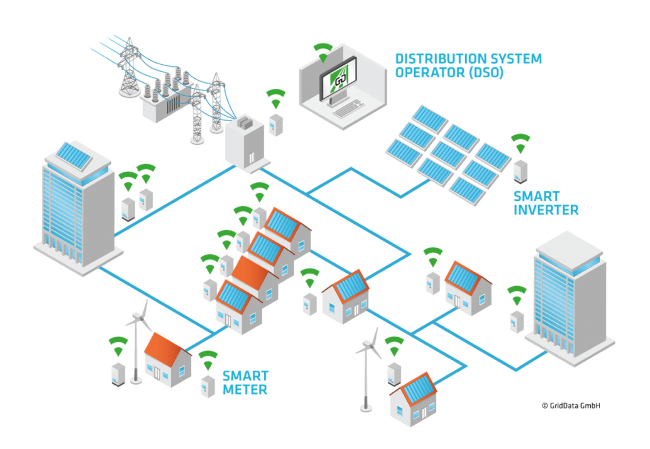
Image credit: European Utility Week-2019
- Consumers classification by using load profiles’ data
- Categorization following today’s standard profiles as defined by ElCom
- Clustering and study of customers’ groups’ consistency in terms of grid and energy related cost
- Clustering of grid elements
- Identification of irregular characteristics
- Sensitivity and comparative analysis
Standard load profiles were used to sort the smart meters (SM) according to the different consumption categories (VK) (Figure 2). For each VK it is in principle possible to identify an average peak power, or a distribution of it, and use it for customer-based predictions. However, SM belonging to the same VK can have very different load profiles (Figure 3).
Clustering methods were applied to find more consistent groups of customers, showing a similar behavior (Figure 4). In the next step, the consistency of the groups is analyzed based on grid usage and energy procurement cost.
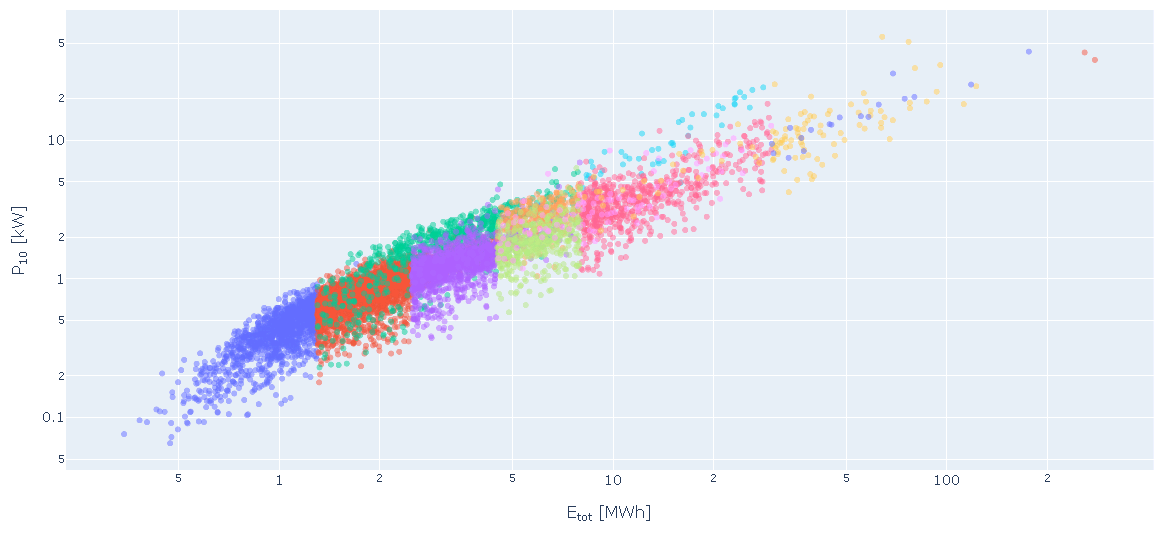
Figure 2. Average peak power versus yearly energy consumption. Different colours indicate different categories.
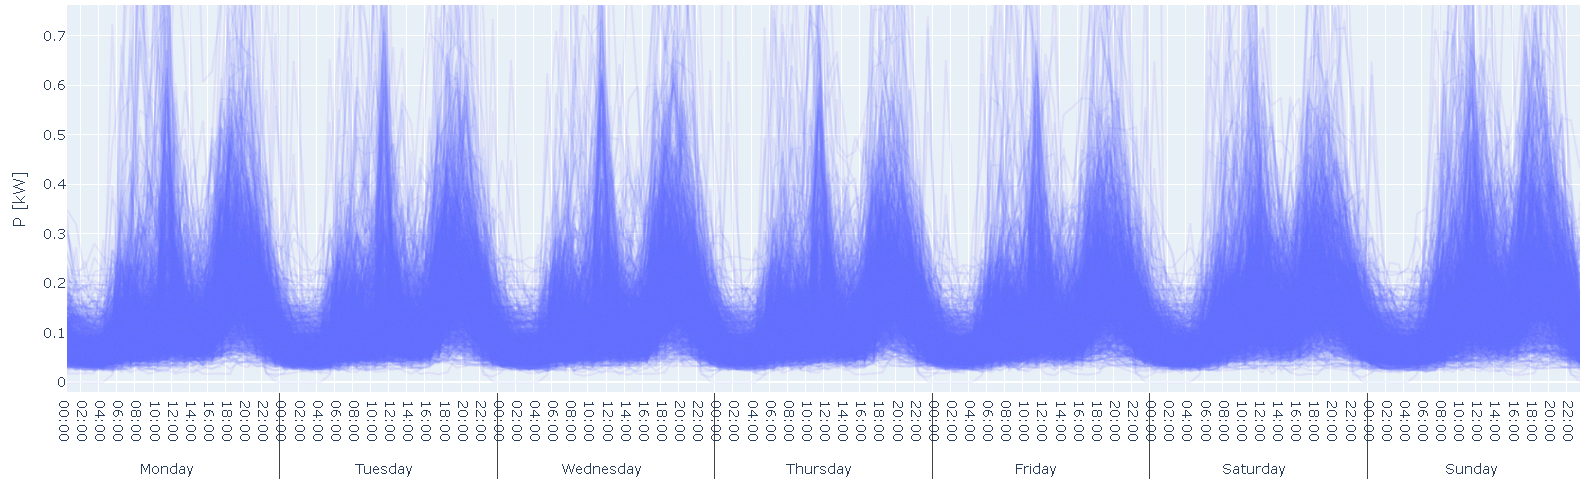
Figure 3. Power weekly average for a group of SM
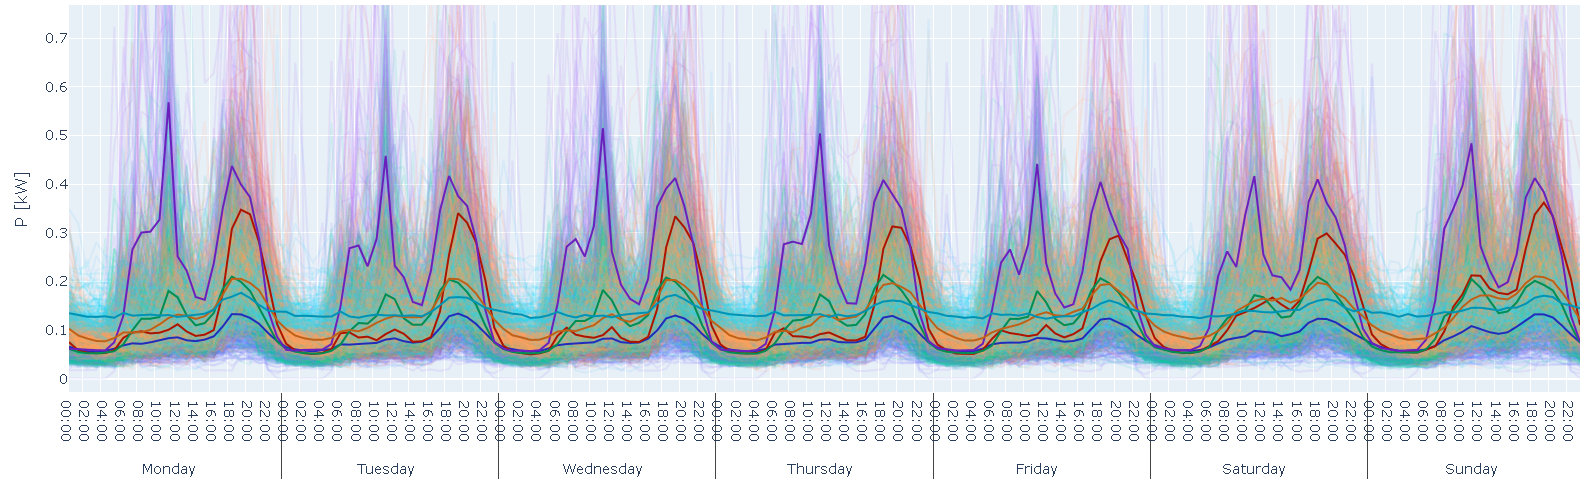
Figure 4: Resulting clusters (different colours) for data in Figure 3. Thick lines represent the mean profile of each cluster.
Project leadership and execution | USI |
Research partner | FHNW Institute of Electric Power Systems, USI, Siemens AG Schweiz, Arbon Energie AG |
Duration | 18 months, from July 2019 to December 2020 |
Funding | SCCER,Innosuisse |
Project team | FHNW: Flavia Sperati, Prof. Dr. Martin Geidl |