Patient Profiling
Visualizing diagnosis lists for effective understanding of complex medical histories
In every medical history, a so-called diagnosis list is created at the beginning and especially at discharge. The diagnosis list includes most of the new diagnoses made during the stay. In addition, the pre-existing diagnoses or episodes of illness are usually documented. Furthermore, diagnosis lists can document findings of individual examinations, anamnesis information or therapies.
A diagnosis list is used to condense the patient's medical history and to pass on this information to colleagues providing follow-up treatment. There are no rules about the formal creation of a diagnosis list, nor are the quantity or level of detail of the contents defined. Therefore, diagnosis lists are practically physician-colored summaries of the patient's medical history and disease profile.
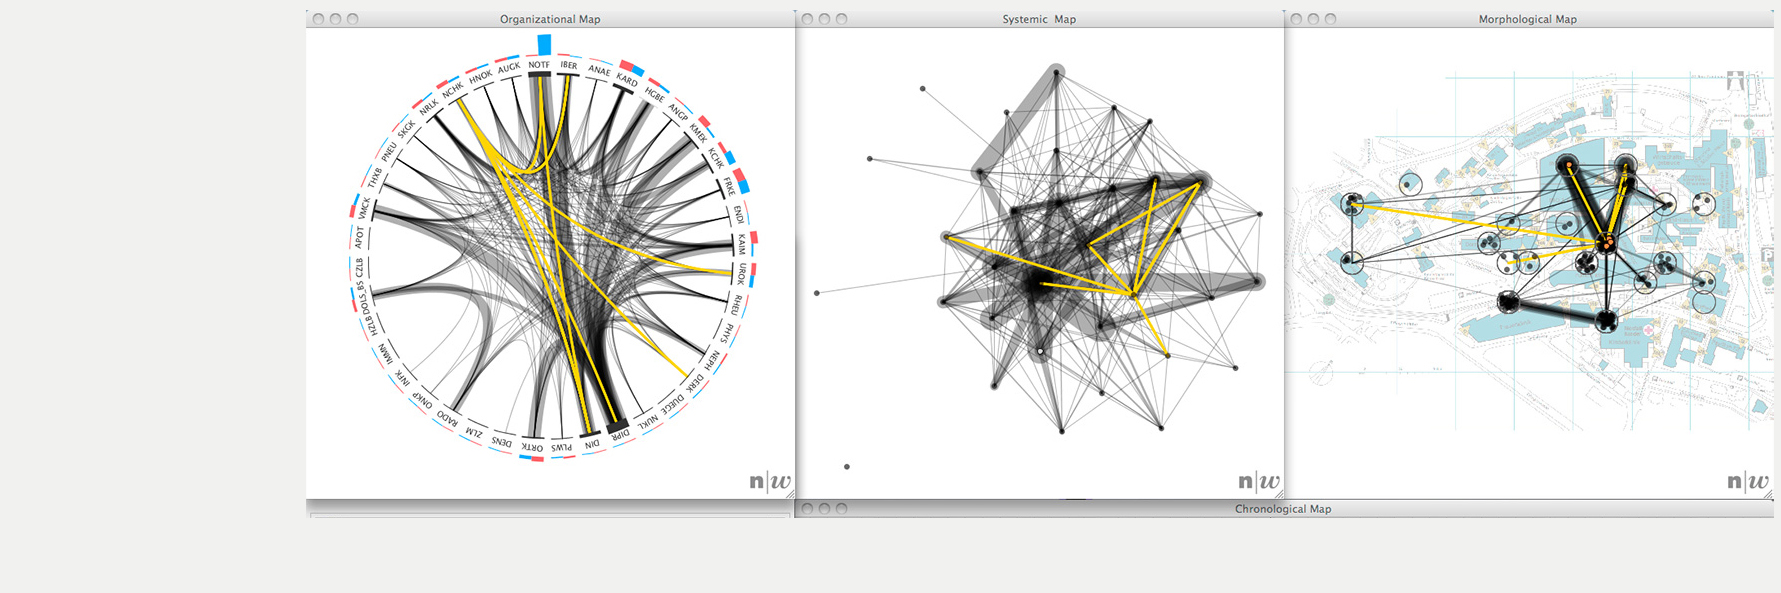
A diagnosis list allows experienced colleagues to quickly get a picture of the patient's documented condition, although the grasp of the complexity and any correlations within the list depend on the knowledge and specific skills of the practitioner. Recognition of patterns or correlations between diagnoses and other data (such as findings, examinations, therapies, etc.) is difficult and very time-consuming due to the abundance of information.
We developed a prototype application that provides various linked visualizations around the diagnosis list, showing aspects such as affected organ systems or skeletal regions, medication, treatments, examinations, etc. and linking them to the relevant terms in the text. Our visualizations facilitate the quick and effective understanding of potentially complex medical histories.
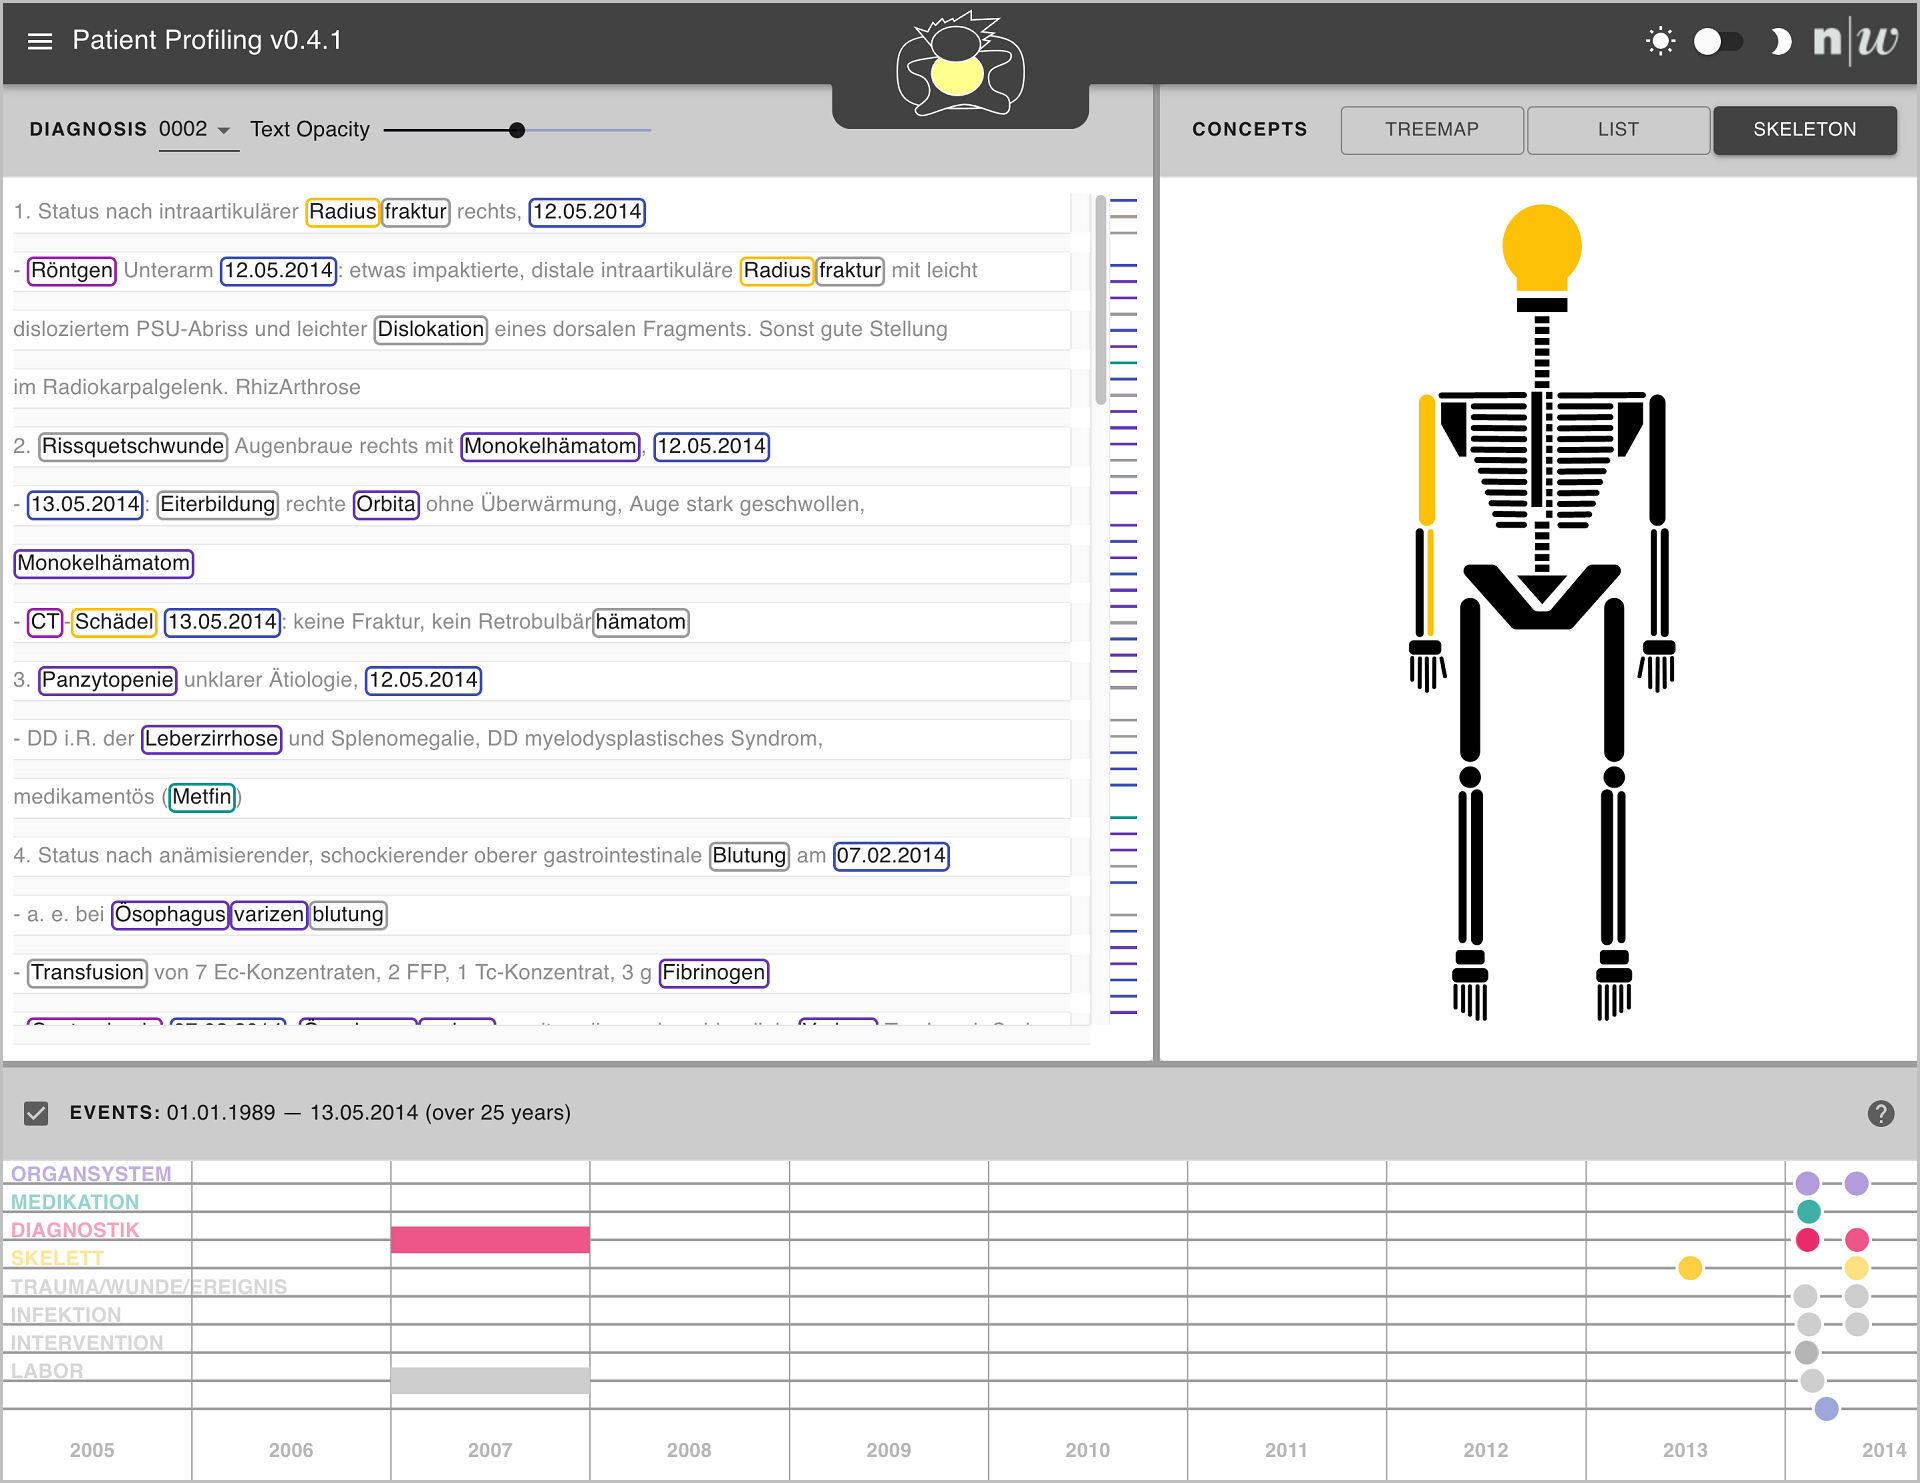
Overview of the “Patient Profiling” prototype. The temporal and skeletal views are two examples for linked visualizations, highlighting different aspects of the diagnosis text.
